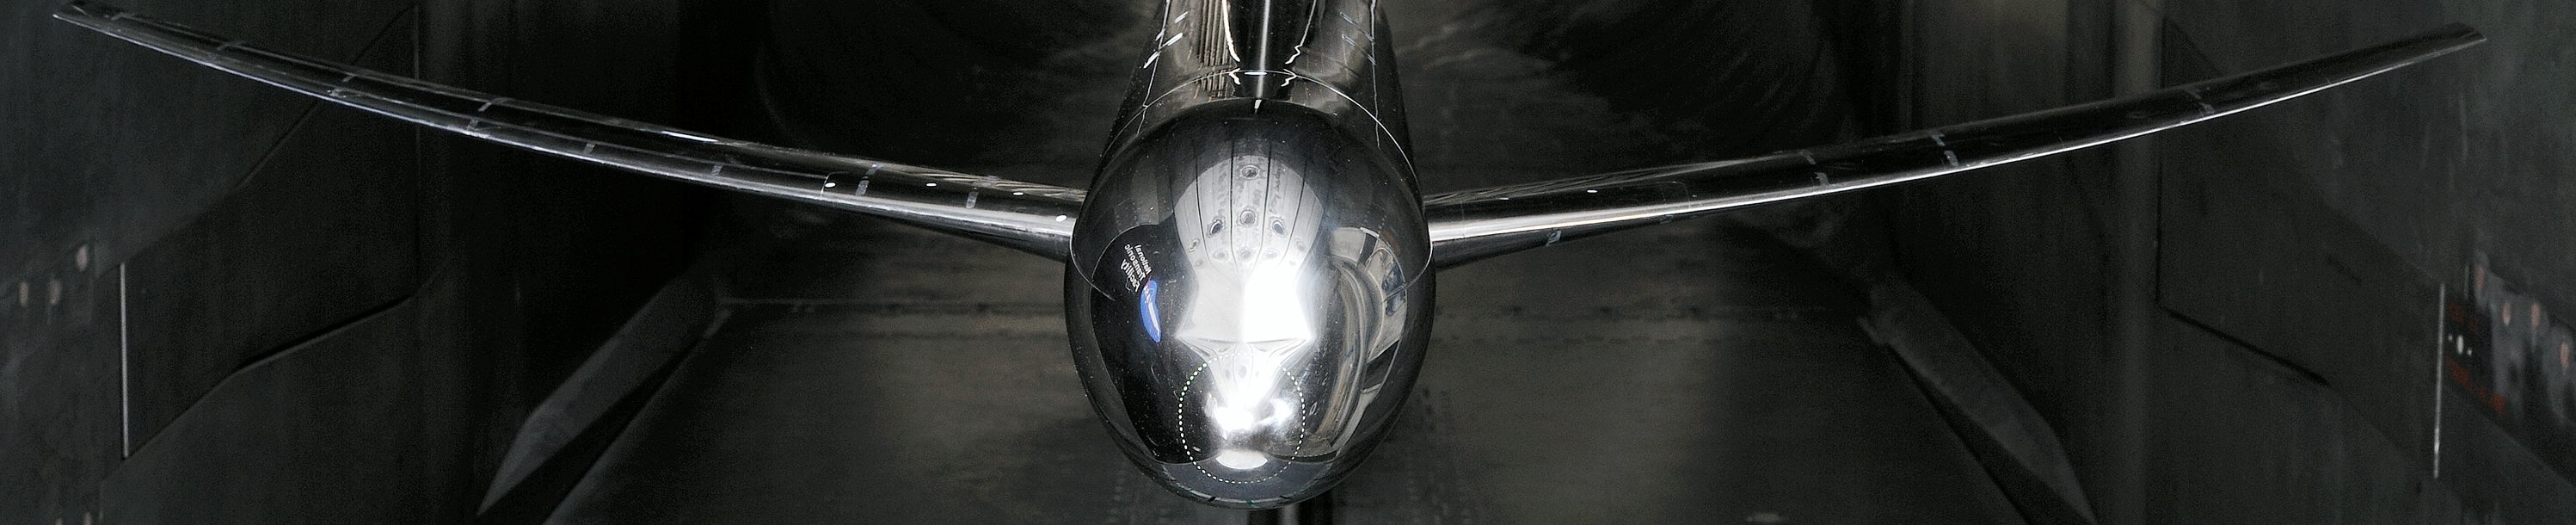
Ames 11-ft Wind Tunnel
Download a copy of the final Ames 11 foot run log CRM Ames Test 216 Run Log
Download a copy of the Ames 11 foot variable names AmesT216VarNames
The investigation, conducted over a 5-week period, provided force and moment, surface pressure, and surface flow visualization data. Testing was conducted at a chord Reynolds number of 5 million. The data were collected at temperatures of approximately 100º F.
All data presented were obtained at freestream Mach numbers ranging from 0.7 to 0.87. Data were generally obtained over an angle-of-attack range from -3° to +12° at 5 million chord Reynolds number. Flow angularity measurements were made and upflow corrections ranging from 0.013° to 0.067° were applied to the final data. Classical wall corrections accounting for tunnel buoyancy and lift interference have been applied according to the method presented elsewhere.
Transition was also fixed on the model when tested at the Ames 11-ft wind tunnel. For this investigation, though, only vinyl adhesive trip dots were applied. These trip dots measured 0.05 inches in diameter and were spaced 0.1 inches apart. For a chord Reynolds number of 5 million, a trip dot height of 0.0035 inches was used from the SOB (side of body) to the yehudi break, 0.003 inches was used from the yehudi break to the midwing and 0.003
inches was used from the midwing to the wing tip. These trip dots were installed at 10% chord. Vinyl adhesive trip dots were also applied at the nose of the fuselage and left on for the entire test. When the nacelles were on the model, trip dots were located 0.43 inches back from the leading edge on the outer surface and the inner surface. Finally, when the tails were on the model, trip dots were located at 10% chord and measured 0.003 inches.
Langley National Transonic Facility
Download a copy of the NTF final run log CRM NTF Test 197 Run Log
Download the definition of the NTF variable names NTFT197VarNames.v2. This file was last updated on October 23, 2014. Please discard any variable name file for NTF Test 197 downloaded from this website before this date.
The force and moment data from NTF Test 197 was updated on October 23, 2014. Please discard any force and moment data from NTF Test 197 downloaded from this website before this date.
The investigation, conducted over a 6-week period, provided force and moment, surface pressure, model deformation, and surface flow visualization data. Testing was conducted at 5, 19.8 and 30 million Reynolds number. All Reynolds number values presented in this paper are based on mean aerodynamic chord. The 5 and 19.8 million Reynolds number data were collected to provide a comparison to previously calculated CFD results and all of the Reynolds numbers were used to provide an assessment of Reynolds number effects. The 19.8 million Reynolds number data were collected at two different q∞ levels – a high and a low q∞ condition. Having two q∞ levels at the same Reynolds number provides an aeroelastic step in the data. The data were collected at temperatures ranging from -250ºF up to 120ºF.
Data were generally obtained over an angle-of-attack range from -3° to +12° at 5 million Reynolds number and from -3° to +6° at 19.8 and 30 million Reynolds numbers. The reduced angle-of-attack range at the higher Reynolds number was required such that safe model stress levels would not be exceeded. Flow angularity measurements were made and upflow corrections ranging from 0.092° to 0.173° were applied to the final NTF data. Classical wall corrections accounting for model blockage, wake blockage, tunnel buoyancy, and lift interference have been applied.
In order to ensure a consistent and repeatable transition from laminar to turbulent flow and to support the goal of the wind tunnel data being used for CFD validation purposes, it was important to apply a proven and reliable method to fix transition on the model. Evercoat trip dots measuring 0.05 inches in diameter and spaced 0.1 inches apart (center to center) were used for the current investigation. For a chord Reynolds number of 5 million, a trip dot height of 0.0035 inches was used from the SOB (side of body) to the yehudi break, 0.003 inches was used from the yehudi break to the midwing and 0.003 inches was used from the midwing to the wing tip. These trip dots were installed at 10% chord. Vinyl adhesive trip dots with a height of 0.004 inches were applied at the nose of the fuselage and left on for the entire test. When the nacelles were on the model, trip dots with a height of 0.003 inches were located 0.43 inches back from the leading edge on the outer surface and the inner surface. Finally, when the tails were on the model, trip dots were located at 10% chord and measured 0.003 inches in height.
European Transonic Wind Tunnel
Since this investigation was funded by the European Commission as part of the ESWIRP project, the available budget only allowed for testing over a limited range of conditions. The test plan for the 5-day test campaign in the ETW was determined based on a compromise between test requirements from the European project group chaired by J.L. Goddard from ONERA-France which focused on acquiring data for CFD validations of unsteady wake flows and a repeat of the conditions at which the used CRM model had been tested in the NTF. A few polars were added at a very low Reynolds number to provide comparative aerodynamic data for the Japanese research organisation JAXA who have tested the CRM in a downscaled version in their transonic tunnel.
For achieving the scientific goal of the project, newly integrated measurement capabilities were operated during the campaign: unsteady PIV for wake flow analysis and unsteady and steady model deformation measurements combined with the recording of unsteady balance signals taking the benefit of an upgraded fast high capacity data acquisition system. In the frame of the present paper only aerodynamic data like force, moments and wing pressure distributions combined with the wing deformation are presented. Although, data were acquired at 12 different Mach numbers ranging from 0.25 to 0.87 the majority focussed on M=0.7 and the model design Mach number of 0.85. So, with respect to the intended comparison of results, the reference test conditions of the NTF at these two Mach numbers were carefully set and controlled. To cover the relevant Reynolds numbers of 5, 19.8 and 30 million the tunnel temperature was varied between 302 K and 117 K combined with corresponding pressures between 200 and 300 kPa. The operating envelopes of NTF and ETW do not allow achieving the minimum and maximum Reynolds number at the identical q/E value. Hence, it was decided to duplicate the 19.8 million Reynolds number at a lower and higher q/E value allowing an additional comparison of the model deformation assessment as a function of the different aeroelastic effects. By performing lift polars with the model in upright and inverted position the upwash could be assessed as 0.010 to 0.015 deg over the full operating range. The measured data were additionally corrected for wall interference based on the ETW experimental assessment established in the past. Extreme care is always given to the measurement of the model angle of attack. Before starting the test campaign the electrical offset and misalignment of the relevant inclinometer inside the model is checked even under load applied to it. Special care was also given to the application of the transition band classically used when testing at a chord Reynolds number of 5 million. Performing this work in close cooperation with the NTF experts minimised the risk for later mismatches in the results originated by this sensitive item.
Before facilities like NTF and ETW went into operation engineers were convinced of the rigidity of wind tunnel models not suffering remarkable deformations generated by aerodynamic loads especially present in pressurised facilities. Using the unique capabilities of these tunnels for establishing identical Reynolds numbers at different pressure or better q/E levels the opposite could be proven. Nowadays, the correct assessment of the wing shape under load is mandatory for all comparisons to CFD results. Starting with the developments of appropriate measurement systems with a Moirée tool today, ETW may operate 4 systems in parallel, e.g. for monitoring the shape of the main wing and all high lift components of a half-model. The Stereo Pattern Tracking systems (SPT) are capable of monitoring the shift in space of markers pasted on the lower wing surface. In the test campaign reported here one system was looking on the main wing with 58 frames/sec while a second one monitored unsteady HTP movements with 386 frames/sec.